September 8, 2026 · Mochatrade · 8 min read
Crude Oil, War, and Slippery Slopes
This article familiarises you with the most crucial RWA (Oil) in the most unintimidating way possible with a case study of the recent statement by US Energy Secretary Chris Wright. After this article, you will know what moves the asset, how it is priced, what moves when oil moves, and how to trade better with this new-found knowledge.
I. the best day of the war
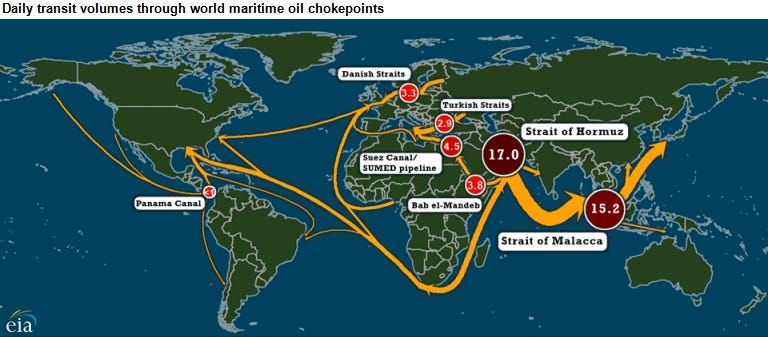
On September 2, US Energy Secretary Chris Wright (America’s petroleum minister) told CNBC that more than 17 million barrels crossed the Strait of Hormuz by ship on August 31, the most since the war opened on February 28. Before the war, Hormuz carried about 20 million barrels a day.
Hormuz is the stretch of water between Iran and Oman. Before February 28 it carried about a fifth of all the oil and gas that moves by sea. Every barrel that leaves the Gulf for an Indian refinery goes through it. So by the American government’s own account, August 31 was the best day the strait has had since the war started.
Now, you already know the reflex. Supply comes back, price comes down. Anyone who has traded a commodity has that wired in.
Brent was about $88 on August 28. By September 3 it was near $95, up 8% in the same week the barrels came back.
And this is not one ticker doing something odd. On September 1, twelve companies in the S&P 500 printed a 52-week low and seven printed a 52-week high, and almost all of it ran off the oil price. Energy closed up 1.3% on the day the Dow lost 400 points, the best of the eleven S&P sectors. Marathon Petroleum traded at $381.15, a price it had not seen since June 2011. Energy is up 21% this quarter and 43% this year, first on both counts.
The barrels came back and the price went up anyway. The rest of this piece is me taking that apart, one claim at a time.
So why did it go up?
II. what an oil price is made of and why is it important?
As the popular saying goes, when in doubt, zoom out. To figure out why oil disobeyed the very fundamental supply-demand economics, we must first understand how it works.
Oil is not a thing most people buy. It is an input into things everyone buys: the diesel under a truck, the fuel in an aircraft, plastic, fertiliser, paint. So the price of crude in September shows up in the price of everything crude touches over the months after.
Now that we understand how it affects every other price in the market (inflation), let us understand what factors are used to price such a crucial asset and what went wrong this time. A barrel of Brent is priced off four things:
Barrels moving now. Production out of the ground, and shipments on the water. This is the number Wright was talking in his “17 million barrels” statement. The mechanism seems pretty clear: More barrels sailing, cheaper oil and vice versa. This factor is the one that gets affected when the Strait of Hormuz undergoes blockages due to war.
Barrels sitting in storage. Since every refinery, trader and government holds crude in tanks, and that stock is what can be drawed on when a shipment is late. Storage is the buffer between a disruption and an actual shortage (shortages = higher prices). Fuller tanks mean cheaper oil, (because a bad week can be absorbed without anyone facing scarcity) and emptier tanks mean more expensive oil, because there is nothing behind a failing shipment.
Demand. How much oil the world wants to burn this quarter: factories, freight, flights, heating. It moves slowly and it moves with the economy, which is why oil falls in a recession while supply sits untouched. More demand, dearer oil. Less demand, cheaper oil.
The premium for the risk that the next barrel does not arrive. This is the factor that goes unnoticed most of the times (which also makes it interesting). This is also different from the first three variables as this isn’t a quantity, but a price.
Factor one is a barrel that failed to arrive. This is a barrel that might. When a strait is dangerous, a cargo already on the water beats a promise of one next month, so buyers pay up for the certain one. More doubt, dearer oil, even when the first three have not moved.
III. so what moved it
Now that we have the four factors that influence, they will lead to the explanation. Two out of our four factors can be ruled out by data.
Storage first. The EIA (America’s official energy statistics agency) reported on September 2 that US commercial crude stocks fell 4.5 million barrels in the week to August 28, to 424.5 million barrels, still 1% above the five-year average. Tanks sat where tanks normally sit.
Demand next, and it points the wrong way. Over the four weeks to August 28, total US product supplied averaged 20.4 million barrels a day, down 4% on the year. Petrol down 2%, diesel and heating oil down 6%. America burned less oil this August than last August, and the price went up anyway.
But the question still remains: what moved $BRENT? Well, nobody knows the definitive answer. Under the assumption that commodity charts never lie, the smartest people in finance have been puzzled by this pricing in and are speculating along with us. However, we can settle on a few plausible explanations here:
The barrels really did stop. On August 30, American forces hit Iranian missile launchers on Larak Island. Iran fired back at American bases. Late on August 31, two Saudi supertankers were struck minutes apart. Two very large cargoes coming off the water is factor one moving and it clearly reflected in the price.
The barrels kept moving and the odds changed. Under this reading, the strikes took very little volume off the water and reset the probability of something worse instead. That is factor four, and it behaves differently: the premium holds as long as the war does, whether or not another tanker is ever hit.
Nobody could verify factor one, so the market priced the doubt. Wright put August 31 above 17 million barrels. Kpler’s (global data analytics and market intelligence company that specializes in tracking physical commodities) preliminary and unverified count for the same day was five vessels, none of them liquid tankers. TankerTrackers (an independent research firm that tracks global crude oil shipments) put it at 9.14 million barrels including the bypass routes, and Samir Madani, who co-founded TankerTrackers, said Wright had stacked several days into one figure. He called it mathemagics.
Three organisations, three methods, three answers, and no reason to think any of them is lying. Which leaves a market handed reassurance it could not check. An unverifiable flow number is not a flow number, it is a reason to keep paying the premium.
We do not know which of the three did the work, and neither does anyone quoting a price target on television. The chart is the only object in this story nobody disputes: about $88 on August 28, near $95 on September 3.
IV. what’s next for you
You cannot know today which explanation did the work. You can know what each one has to do next.
If the tankers did it, the price decays. Cargoes get replaced, so with no fresh strikes the move gives itself back over weeks. If the odds did it, nothing fades, because the premium pays for a condition and not an event. If the counting did it, one clean week ends it: the moment Hormuz flow gets a number three parties agree on, the doubt leaves the price.
The equities are not one trade. September 1 already showed you the split: twelve S&P 500 companies printed a 52-week low and seven printed a 52-week high, off the same oil price.
A producer sells crude, so it tracks the price. A refiner buys crude and sells petrol and diesel, so it earns the gap between them, not the level of either. That gap is the crack spread, and it is why Marathon Petroleum printed $381.15, its highest since June 2011, with its refining margin going from $17.58 a barrel to $36.33 year on year. Then the fuel buyers: United projected nearly $6 billion in extra fuel cost for 2026 against its own start-of-year assumptions, and no major US carrier hedges financially.
What to look for. The front Brent month against the six month on the ICE strip rather than the headline price. Whether Kpler and TankerTrackers converge on a weekly flow figure. Distillate stocks against the five-year average in Wednesday’s EIA report, which sat 14% below it in the week to August 28 while crude sat 1% above. And on Friday at 6:00 PM IST, whether US core inflation comes in above July’s 0.2%, since core strips out fuel and picks this up later through airfares and freight, with the Fed meeting on September 15 and 16.
None of this lands while you are awake. Core inflation at 6:00 PM IST, the Fed late at night, a supertanker hit at 4 AM. Join the waitlist.
Educational content only. Not investment advice.
MochaLearn is a free A to Z course on understanding and trading US stocks and commodities, built for Indian traders.
Terms in this story
- Real-world asset (RWA)A real-world asset is a physical or financial thing, gold, oil, a US share, whose price you can hold a claim on and…
- Strait of HormuzThe Strait of Hormuz is the stretch of water between Iran and Oman that carried about a fifth of the world's seaborne…
- S&P 500The S&P 500 is about five hundred of the largest American companies, weighted by market value, and the number money is…
- VolumeVolume is how many shares or contracts changed hands in a period. About half of US stock volume is filled off exchange…
- Crack spreadThe crack spread is the gap between the price of crude and the products refined from it, petrol and diesel. A refiner…