August 22, 2026 · Mochatrade · 1 min read
Mochatrade's charts are now powered by TradingView
Professional charts, drawing tools and indicators, right where you trade.
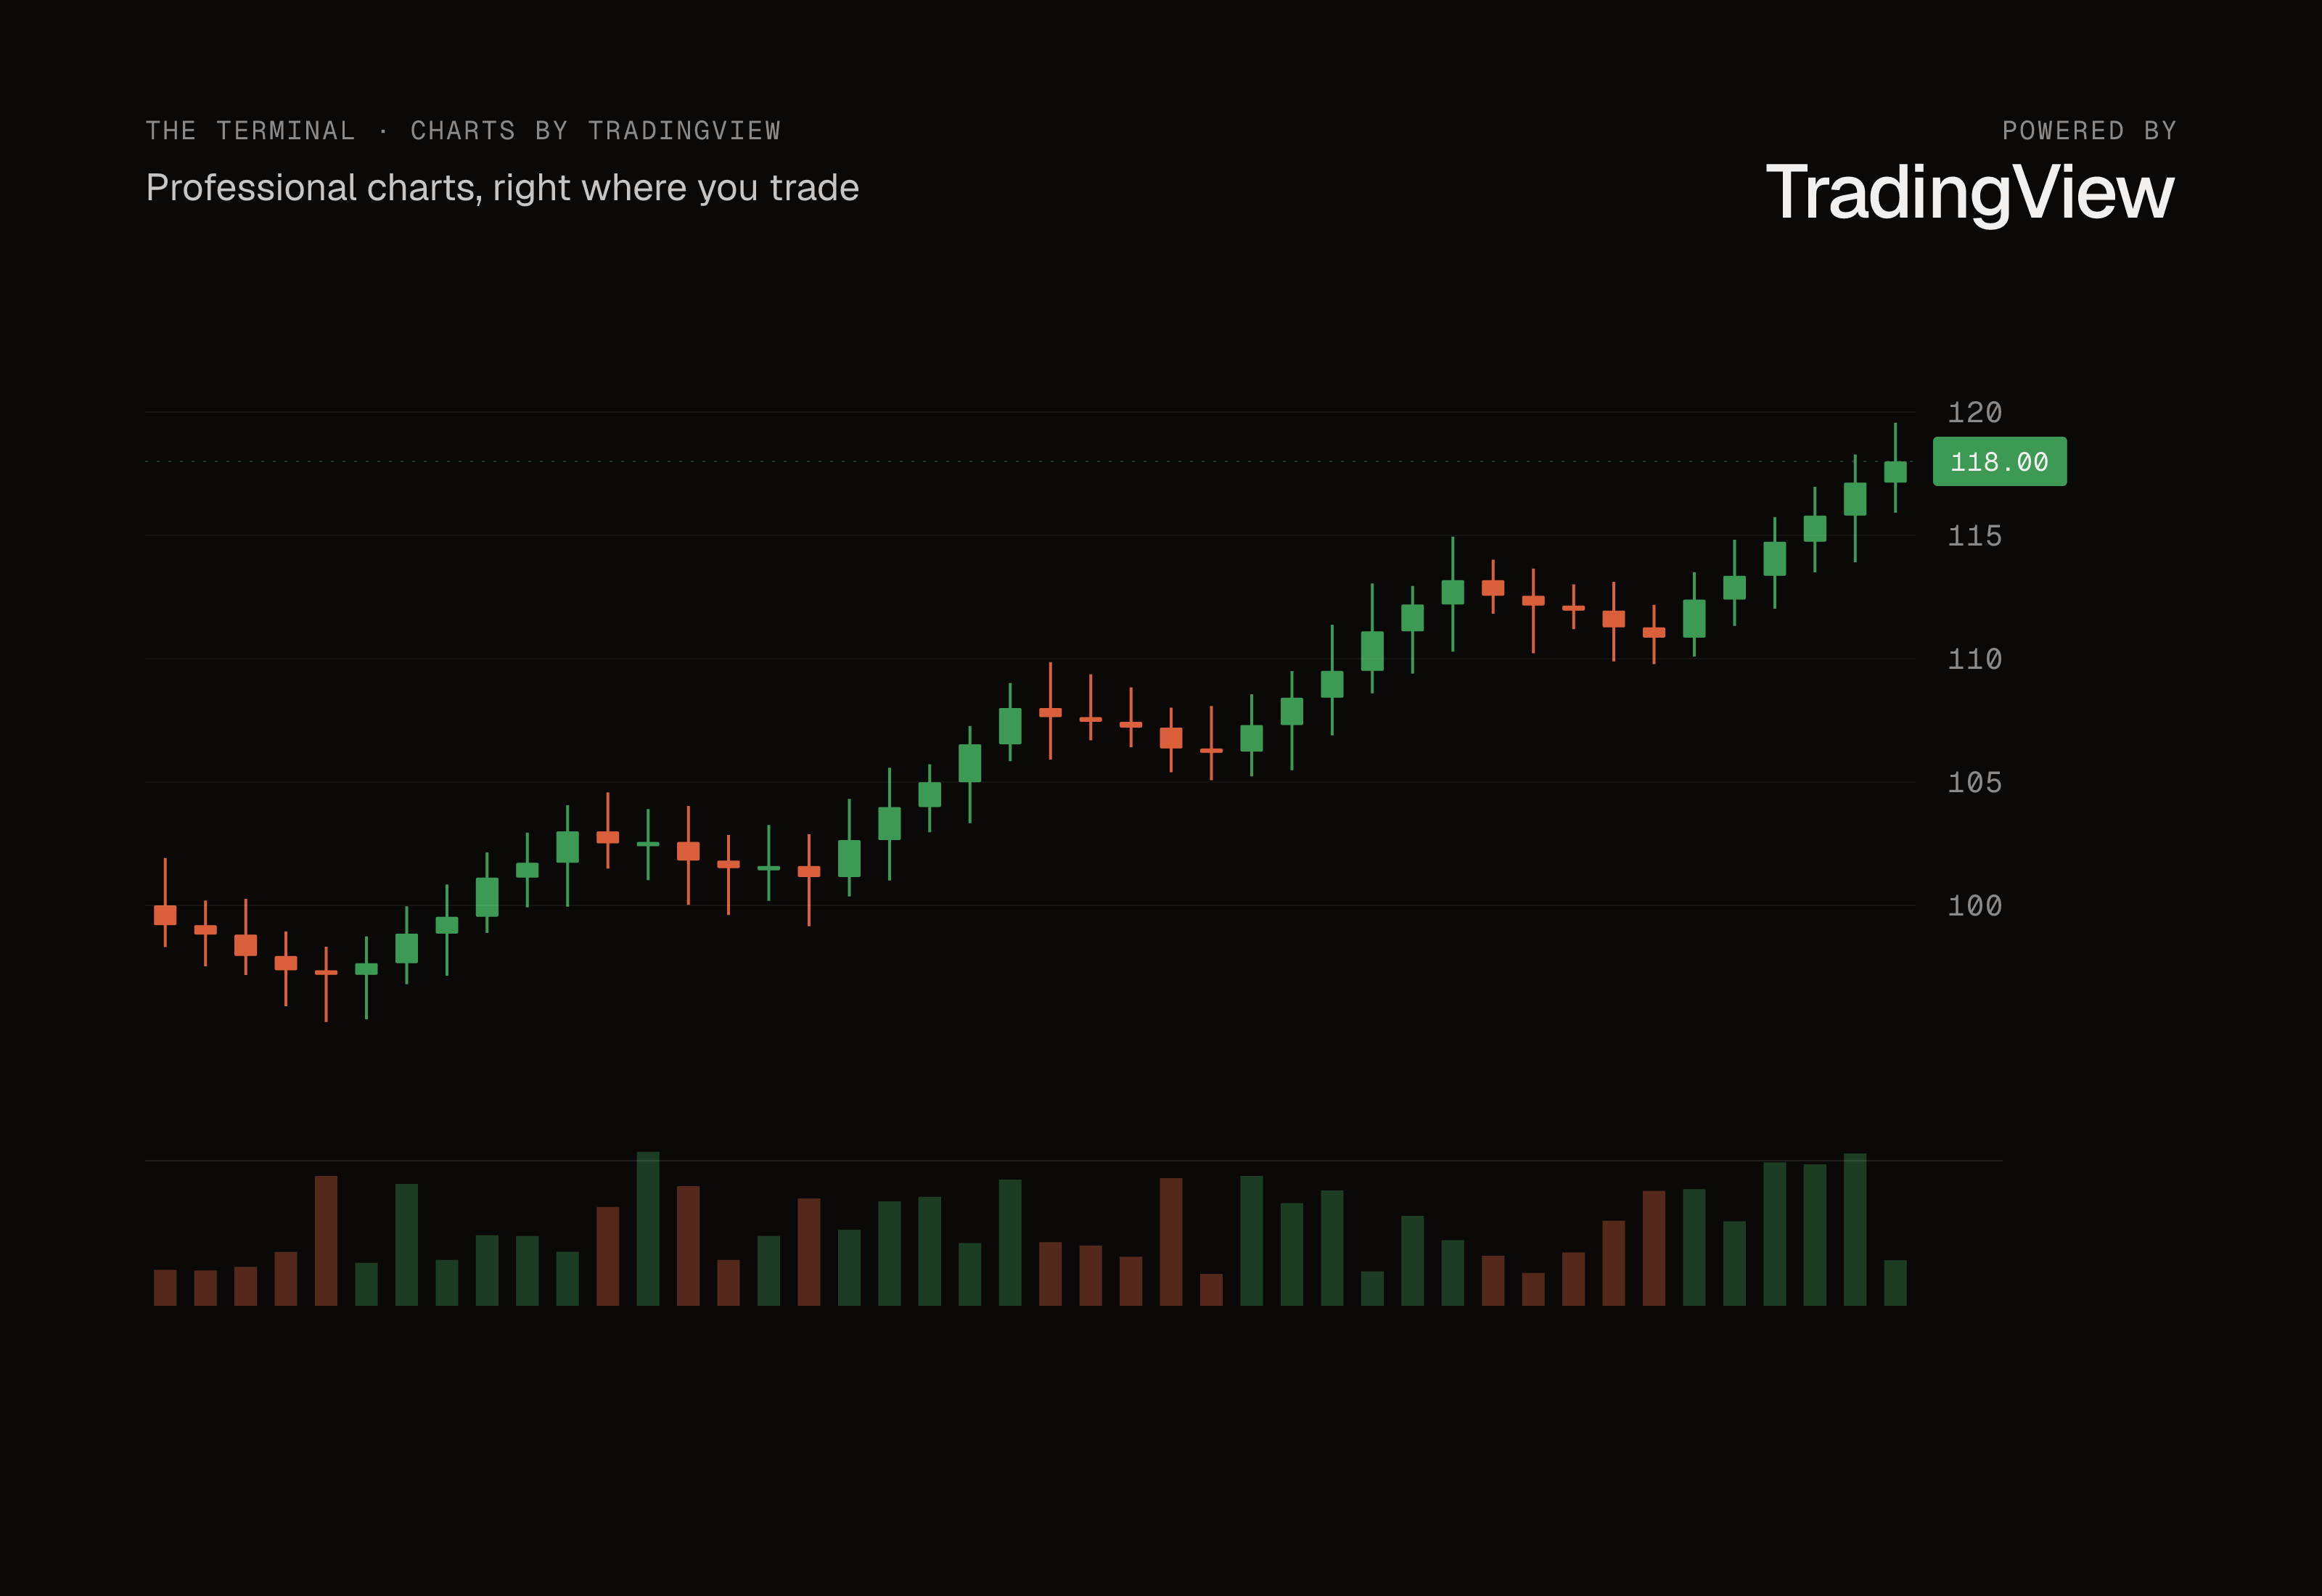
Every chart in the Mochatrade terminal is built on TradingView, the charting platform tens of millions of traders already use to read the market. When you open a stock on Mochatrade, the candles, the drawing tools and the indicators you reach for are TradingView's, set inside our terminal and priced in the currency you trade in.
Why TradingView
A trading app is only as good as the chart you make your decisions on. We wanted our members to start with the tools serious traders rely on, not a simplified picture of the market. TradingView's charts give you:
Candles, bars, lines and more chart types, across every timeframe we list.
The full drawing toolset: trend lines, Fibonacci levels, channels and annotations that stay on the chart.
Indicators and moving averages, with EMA 20, 50 and 200 one tap away.
Your take profit, stop loss and resting orders drawn on the chart, so you can see where your plan sits against the price.
Built into the terminal
The chart sits next to the order book and the ticket, so reading the market and acting on it happen in one place. Switch between rupees and dollars and the chart follows. Change the timeframe or the timezone and your drawings stay where you put them.
You'll find the TradingView credit at the corner of every chart and at the foot of the app. Tap it to explore more of what TradingView offers.
What's next
We're working on showing the mark price on the chart as well as the last trade, so the reference price for your position and the line you're reading are the same. More on that soon.