September 25, 2026 · Mochatrade · 7 min read
Why The 30-Year Treasury Yield Just Hit An 18-Year High
Yields climb. The Treasury blinks. Only one asset holds its ground. A look at what the bond market is actually saying.
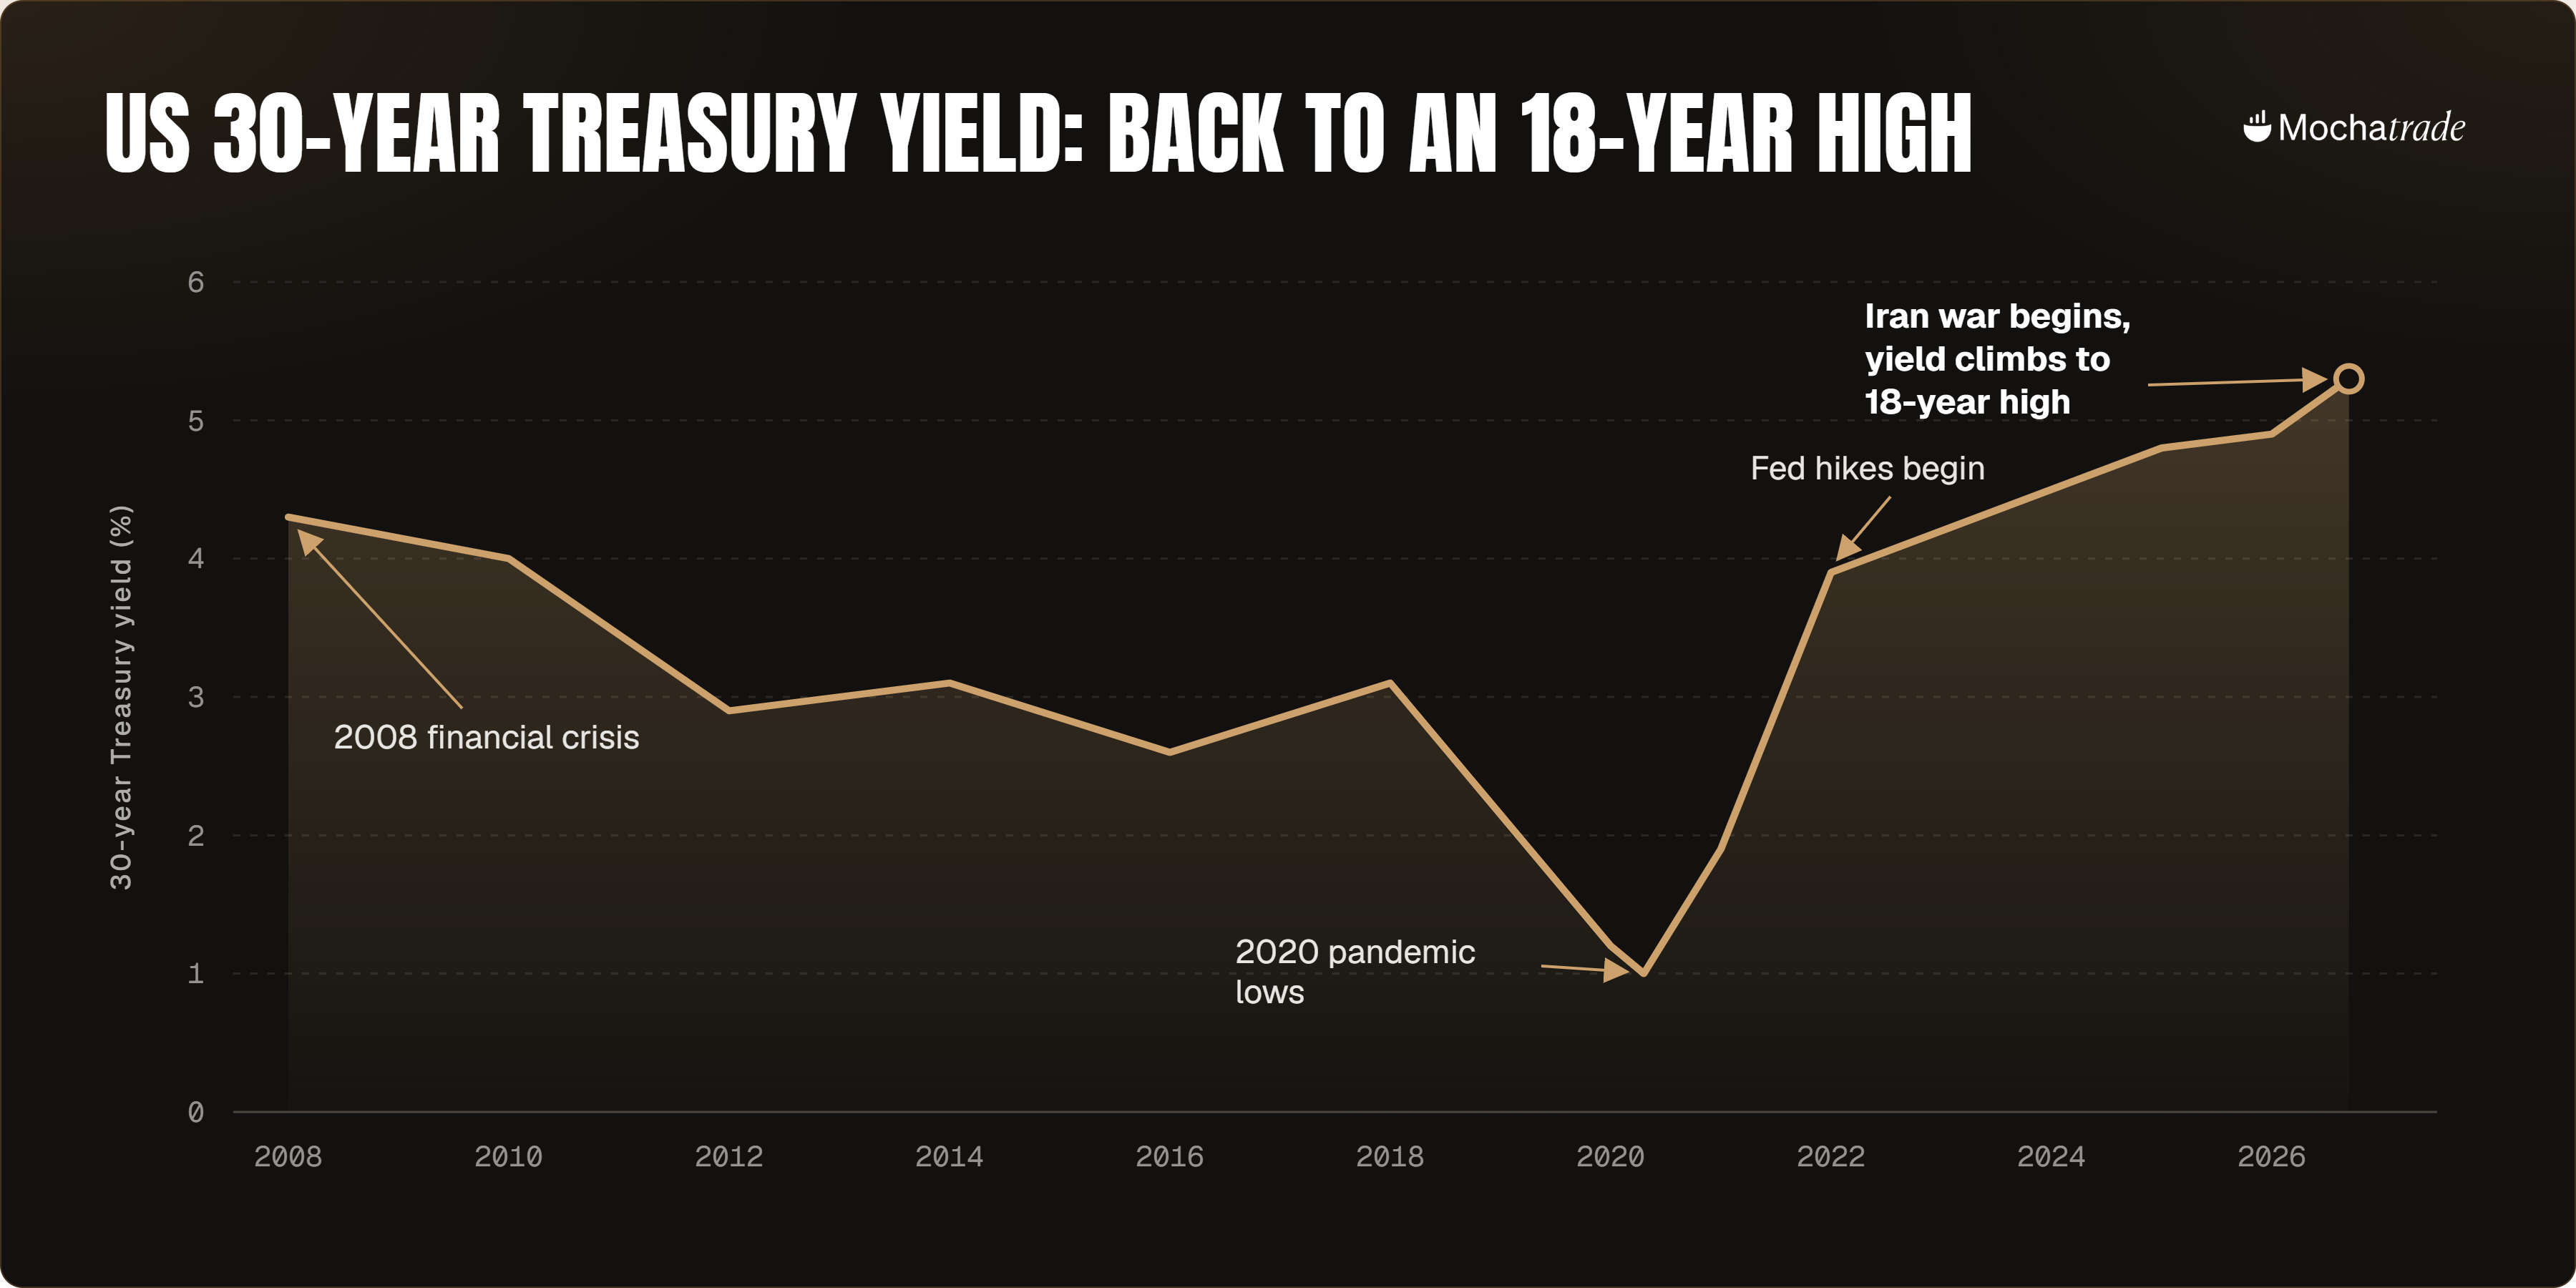
The 30-year US Treasury yield touched its highest level since 2007 last week. On its own, that’s a bond market headline. What’s sitting underneath it is really a story about everything bonds are supposed to protect you from.
What Happened
Oil is back above $100 a barrel, up sharply since July, as the Iran war disrupts shipping through the Strait of Hormuz
August’s producer price index came in at 5.4% year over year, well above the Fed’s 2% target
Diesel prices hit an all-time high this year, up roughly 75%, a cost that quietly moves through everything shipped by truck
The 30-year Treasury yield touched roughly 5.3%, a level last seen in 2007
CPI has now stayed above the Fed’s 2% target for 60 straight months, five full years
None of this sits in isolation. Energy costs feed inflation. Inflation feeds bond yields. Bond yields feed the government’s own borrowing costs. That loop has been running in the wrong direction since February, when the war with Iran began
US 30-year Treasury yield since 2008: financial crisis, pandemic lows, and the climb back to an 18-year high
It’s Not Just America
Bond yields are climbing across the rich world. The UK’s 30-year Gilt sits near 5.9%, its highest since 1998. Japan’s 30-year bond is trading close to its own record, a level not seen since the bond was introduced in 1999. French yields are at their highest since 2009.
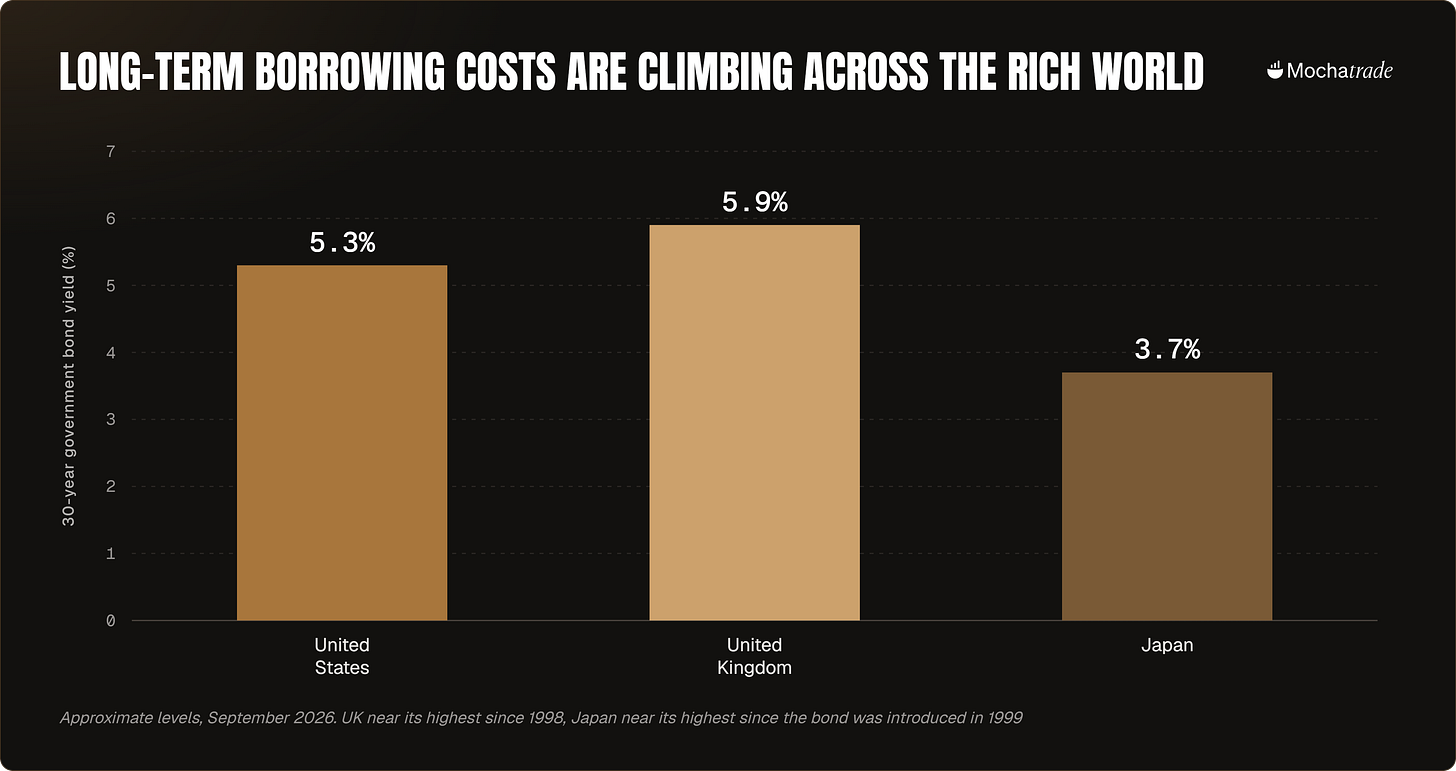
Long-term borrowing costs climbing across the US, UK, and Japan
Part of this is good news. Strong growth pulls yields up too, because governments have to offer competitive returns when money has better places to go, and right now a lot of that money is chasing AI data center buildouts. AI companies alone issued $225 billion in bonds in the first half of this year.
The less comfortable driver is government borrowing itself. The US national debt crossed $40 trillion for the first time in history this year. Outside of wartime or a recession, America has never borrowed this much relative to the size of its economy, and neither condition applies right now. Interest payments on that debt have climbed past $1 trillion a year, more than the entire US defense budget.
That sets up a loop worth watching. Higher yields raise the cost of servicing existing debt, which widens deficits, which can push yields higher again. A cooler inflation reading might ease the pressure for a while. The loop itself doesn’t break until governments shrink their deficits.
The World’s Most Important Yield Just Hit 5%
There’s a second number worth watching alongside the 30-year: the 10-year Treasury yield, the benchmark the rest of the world prices borrowing against, broke above 5% this week for the first time since 2023.
The setup differs from 2023. Back then, yields climbed because traders bet the Fed would keep hiking and hold rates higher for longer. This time, inflation fears tied to the Iran war and rising energy prices are doing the pushing, alongside a Fed that markets now expect to hike rather than cut.
For everyday borrowing, that benchmark feeds straight into mortgage rates and car loans. Companies face the same higher costs when raising debt. Washington pays more to finance the $40 trillion it already owes.
The reach goes well beyond American borrowers. Treasuries set the reference point the rest of the world prices against. When investors can earn 5% lending to the US government, a bond in Indonesia or a stock in South Africa has to offer something clearly better to compete for the same capital. That pulls money toward the US and makes it harder for emerging markets to refinance debt owed in dollars.
It cuts especially close to the AI trade. AI stocks are priced on profits expected years out, and higher yields make those future dollars worth less today, the same math nudging some investors to trim AI positions in favor of Treasuries. Meanwhile, the AI buildout itself runs on borrowed money that just got more expensive.
5% resets the price of money everywhere, well beyond bond traders themselves. If yields keep climbing, it becomes one of the sharper tests of whether richly priced stocks can keep climbing too, or whether capital rotates back into bonds instead.
The Fed’s Problem
At the start of 2026, markets expected the Fed to cut rates three times this year, a total of 75 basis points. Now they’re pricing in two hikes instead, 50 basis points, a 125-basis-point swing in under a year. Kevin Warsh, the new Fed Chair, took over expecting to cut. His first real move looks like a hike instead, with inflation still running hot and energy costs climbing on top of it.
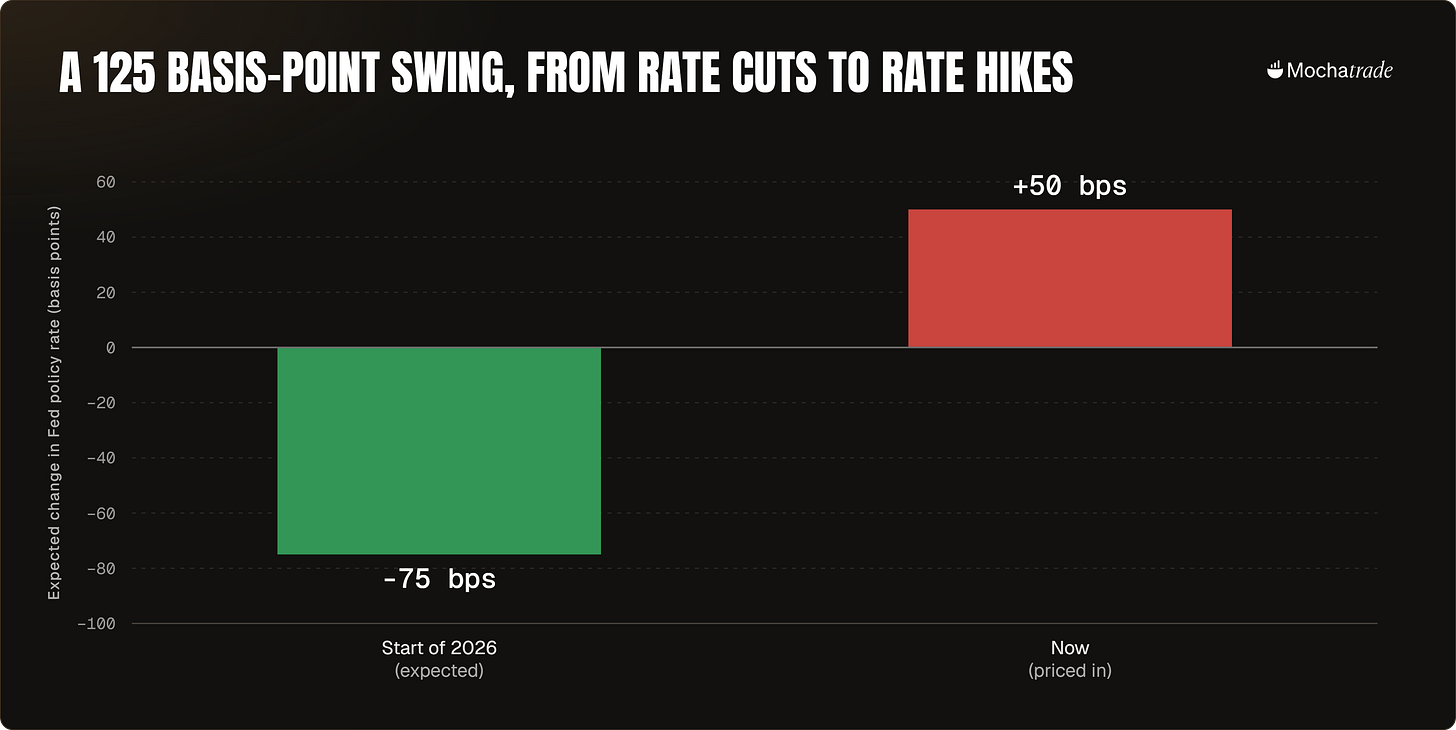
Fed rate expectations swung from three expected cuts to hikes now priced in, a 125 basis-point reversal
The Treasury Tried To Step In, The Market Answered Back
On August 19, the US Treasury announced it was intervening directly in the bond market, buying back long-term debt to push yields down. It doubled its buyback program initially, then tripled it, to $6 billion per operation.
Yields rose anyway. Investors kept selling even as the government tried to prop up prices, a strange thing to watch happen in the world’s most important bond market. When the buyer of last resort shows up, and the market shrugs it off, the skepticism runs deeper than one announcement can fix.
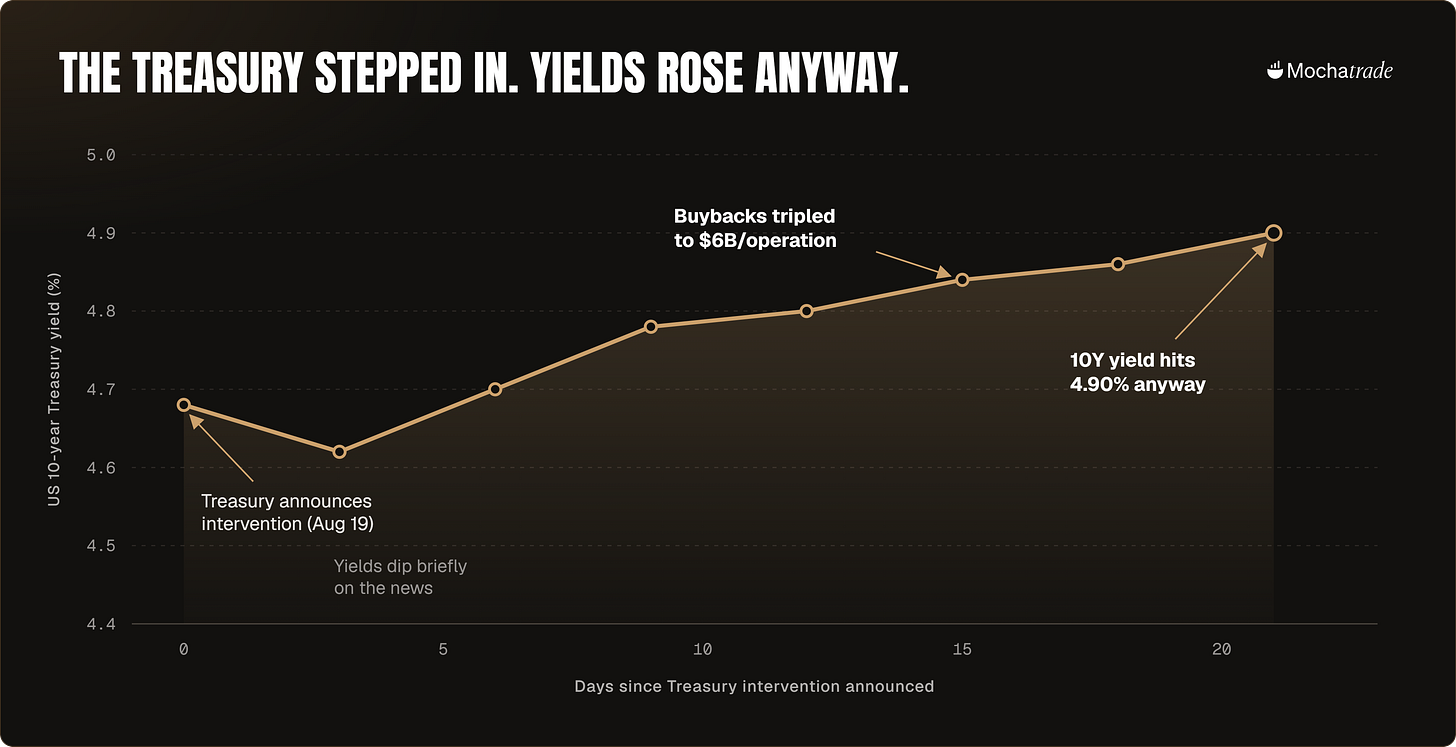
The 10-year Treasury yield kept climbing even after the Treasury tripled its bond buybacks
Why Washington Keeps Spending Anyway
Even with borrowing costs this high, the federal deficit keeps growing. The Committee for a Responsible Federal Budget projects it could reach $2.6 trillion annually by 2035, with no serious plan on the table to change that trajectory. Against that backdrop, the administration has floated a $5,000 payment to every adult citizen if Republicans hold the midterms, a proposal that would cost roughly $1.2 trillion, one of the largest single stimulus measures since the pandemic.
Rising borrowing costs and a bigger spending plan are an unusual combination to see at the same time. That’s exactly where things stand right now.
What The Market’s Betting On
Since the Treasury’s intervention on August 19, Bitcoin, gold, and stocks all popped together, and for a moment it looked like the classic debasement trade: every asset that isn’t cash moving up at once.
Three weeks later, Bitcoin is still up roughly 20% from its pre-intervention level. Gold and the S&P 500 have both round-tripped back to close to flat, even slightly negative. The initial spike faded fast for two of the three assets, and only one backed up the story with real follow-through.
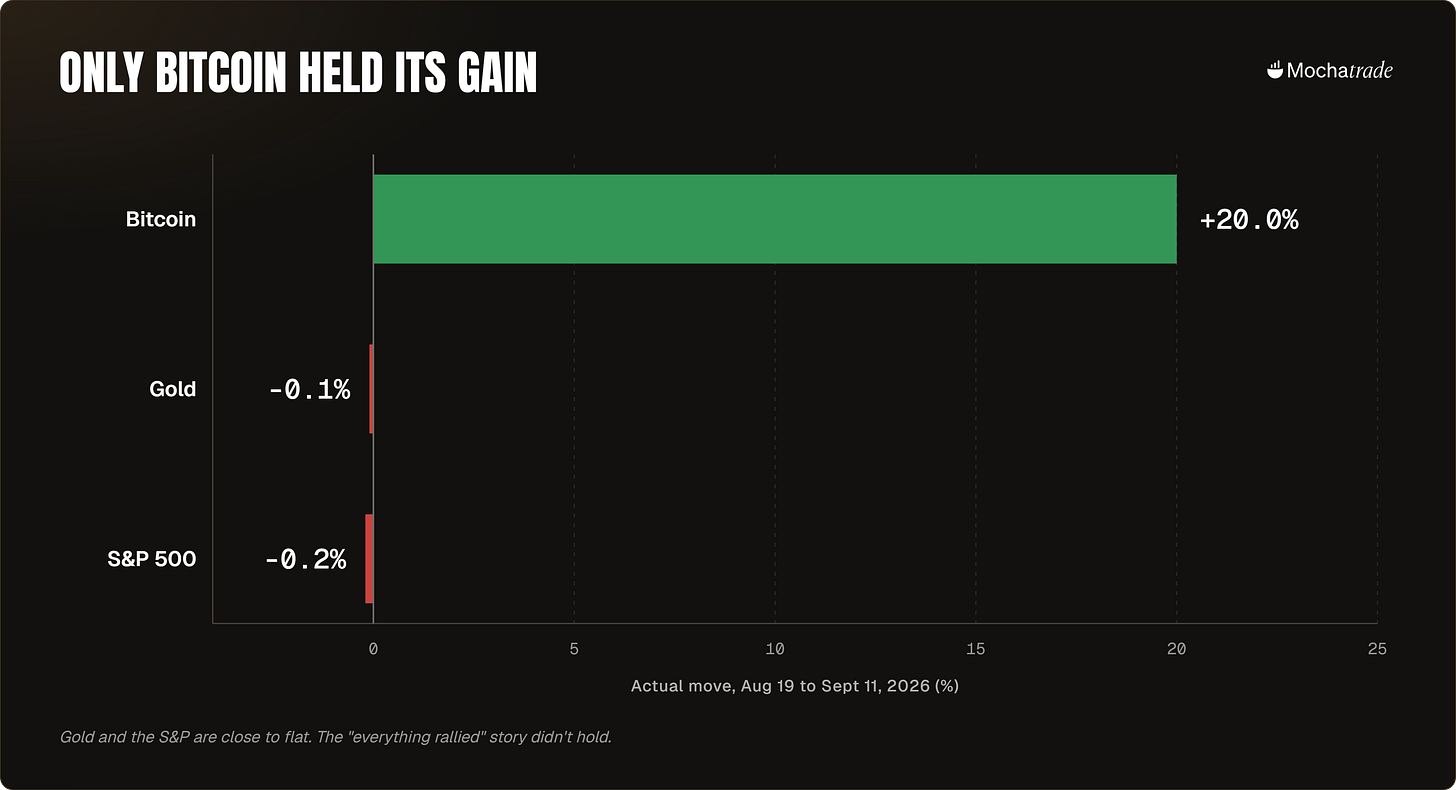
Only Bitcoin held its gain three weeks after the Treasury’s intervention. Gold and the S&P are close to flat over the same stretch
That points to something narrower than the original story: crypto is currently doing more of the safe-haven, debasement-hedge job that gold and stocks were supposed to share. Whether that keeps holding is a separate question, and one worth watching rather than assuming.
The K-shaped idea still holds; it just plays out differently than expected. Whoever owns Bitcoin came out ahead. Whoever was counting on gold and stocks riding the same wave is roughly back where they started. Growth splits into two lanes: asset owners who picked the right asset keep compounding, while people relying on wages or cash savings watch inflation eat into what they have.
The Fear Underneath All Of This
I’ll be upfront: nobody knows if history repeats here. But the pattern, energy shock, sticky inflation, a central bank forced to choose between growth and price stability, rhymes closely enough to take seriously. The comparison people keep making is to the 1970s, when inflation came down, everyone relaxed, and then a second wave hit even harder than the first.
What This Means
Inflation cooled after 2022 and mostly fell out of the headlines. It never fully went away. War-driven energy costs, a Treasury market demanding higher yields even after direct intervention, and a government still spending heavily are now pulling in the same direction at the same time. Watching the bond market right now tells you more about what’s coming than watching the stock market does. Three or four data points moving in the same direction tell you more than any single one on its own.
Educational content. Not investment advice. Figures are approximate as of September 2026.